
We launched our new High Performance Virtual Servers (HPVS) this week. With a name like that, we know that this platform really has to deliver. After a lot of careful development work we’re proud to say that SiteHost HPVS operate at speeds that you’ll struggle to find anywhere else - and that we have the data to prove it.
Updates:
Since the Linux-only launch, we've added Windows High Performance Virtual Servers as well.
"We built it for High Performance Virtual Servers, and now our new virtualisation technology enables new features on Cloud Containers and other servers too." (November 2024)
Building a true high performance platform
Want to deliver amazing performance? There’s no getting away from the importance of hardware. That’s where it starts.
We already knew from this year’s new Dedicated Servers that AMD’s Ryzen 9 CPUs pack some serious performance into a very well-priced chip. We’ve been all-in on NVMe storage for years now, so we didn’t have to think twice about that. The bones of these machines are incredibly sturdy.
But once the metal is all assembled, there’s still more to do. Virtualisation, which divides the resources of one incredibly high-spec server across multiple accounts, converts the potential performance of hardware into actual performance for businesses like yours. We’ve adopted new technology to create a virtualisation layer that will be in service for many, many years.
On CPU speed our HPVS is 1.84x times faster than the next best, and we cut 45% - nearly half - off the next-best latency.
To compare servers from different providers you need to see them in action. Just comparing hardware models isn’t enough. You need to see how things actually run. So, let’s race our HPVS against some formidable international competition.
Picking comparable servers from Vultr, Linode (Akamai), DigitalOcean and SiteHost
The first step in benchmarking is to pick a range of comparable servers. There’s no glory in showing that our 30 Core High Performance Virtual Server is quicker than someone else’s standard 1-core VPS.
So we looked through four providers’ shared CPU plans (including our own) and chose seven two-core options. They all cost between US$20-27, which is a good match for the NZ$40 price tag of our two-core HPVS.1
Three of them are standard virtual servers, which give us a useful baseline:
AWS t3a.medium (AMD EPYC)
Vultr “Regular Performance Cloud Compute”
Our own standard Linux Virtual Server
Then there are four high performance plans:
Vultr “High Performance Cloud Compute” with AMD EPYC CPUs
Linode “Shared CPU Plan - 4G”
DigitalOcean “Basic Droplet - Premium AMD”
Our new 2 Core High Performance Virtual Server
All seven servers were running Ubuntu Jammy (22.04). All except the AWS instance went through the same benchmarking test.
Weeks of sweat tests on a level playing field
We used Sysbench, an open source benchmarking tool with a test designed specifically for CPUs. This test sends requests to the server to calculate thousands of prime numbers and measures how quickly that work gets done. Sysbench reports on “CPU events”, which correspond to a single CPU operation, tracking how many events occur in a given period of time.
For the AWS instance, we ran the test long enough to see performance level out. After a few minutes, once we were confident that the results were fair and representative, the test ended. (We don't like to leave AWS instances running, given our experience with AWS cost management.)
For the other six servers, we started with runs only a minute long and built up to a testing cycle that lasted 59 minutes, followed by a 1 minute break. That cycle ran on each server for two full weeks.
The two important results given by this test are:
CPU speed, the average number of CPU events per second, and
Average latency, or milliseconds (ms) taken per operation.
Both of these measure real-world performance over time, rather than theoretical maximums or abnormal peaks.
Raw numbers show SiteHost on top
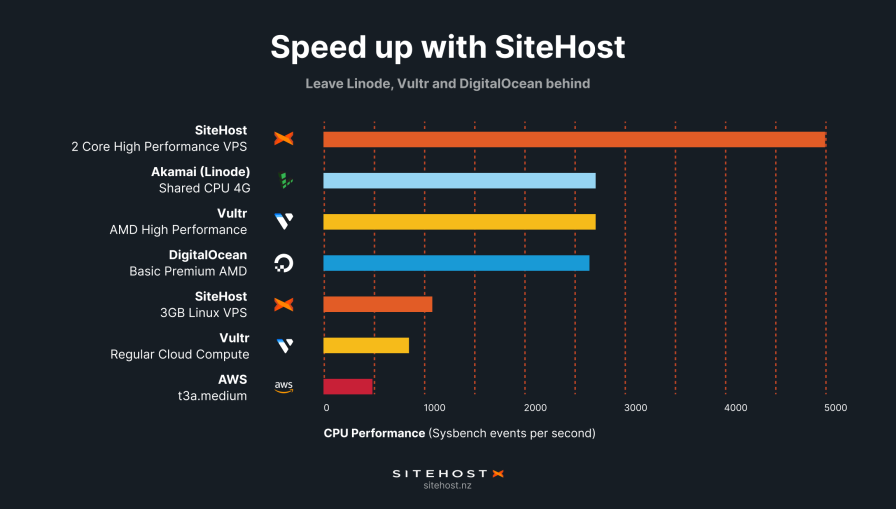
Here are the final results from our benchmarking:
Server | CPU events/sec | Avg latency (ms) |
AWS t3a.medium | 499 | 4.01 |
Vultr Regular Performance Cloud Compute | 863 | 2.31 |
SiteHost standard 2 Core Linux Virtual Server | 1086 | 1.83 |
DigitalOcean Basic Droplet - Premium AMD | 2656 | 0.75 |
Vultr High Performance Cloud Compute | 2724 | 0.73 |
Linode “Shared CPU Plan - 4G | 2728 | 0.73 |
SiteHost HPVS | 5018 | 0.40 |
Firstly, as you would expect, there’s a big jump from regular VPS to performance plans across the board. It’s good to see the industry delivering on the “performance” promise.
Secondly, within performance plans our international competitors are closely bunched. Their results vary by less than 3%.
Finally, there’s a clear winner. On CPU speed our HPVS is 1.84x times faster than the next best, and we cut 45% - nearly half - off the next-best latency.
Related articles (2025):
Out-performing the international competition
The most important lesson here is that you don’t need to look a long way overseas to find seriously high-performing virtual servers. In fact, our machines running out of Auckland and Sydney deliver more than the big names we’ve tested ourselves against.
High performance comes from investment in well-selected hardware, from expert management of the virtualisation layer, and from data centres with strong connectivity. Our benchmarking has proved that here at SiteHost, we can deliver all of these things more strongly than some of the most recognised names in the game.
Want to see for yourself? Spin up a Linux High Performance Virtual Server or Windows HPVS today and start discovering what it’s capable of.
1 Competitors' server specs sourced from:
aws.amazon.com/ec2/instance-types/t3/
vultr.com/pricing/#cloud-compute/
linode.com/products/shared/
digitalocean.com/pricing/droplets