
When we dug through the history of CPUs that we've built into Dedicated Servers, we literally saw hardware get 100 times better in 15 years. That got us thinking: what about the rest of the server?
So we’re looking at storage today. The story of hard drives, from HDDs to SSDs and now NVMe, is more complicated but worth telling. And it gives some interesting context to that 100x improvement in CPUs.
When companies leave the cloud, it’s usually because they can rent or purchase hardware that outperforms anything that was available back when they chose AWS, Azure or Google Cloud.
Our starting point will be 2007, when we first offered Dedicated Servers, and we'll look at performance from multiple angles. Bear in mind that the same trends apply to any type of server - Virtual Servers (VPS), for example, have improved in much the same way.
Measuring hard drive performance
To rate the overall performance of any storage medium, three metrics matter.
The drive's capacity - the amount of data (measured in KB, MB, GB, and now TB) that you can fit on the thing.
Input/output operations per second (IOPS), or how fast you can read and write data. Higher IOPS mean it's faster to extract and replace the bytes that you work with. (There's no perfect, objective way to measure and compare IOPS, but we won't get tangled up in those weeds.)
Latency, which is the waiting time for each operation to actually happen.
To grossly simplify, consider a bookshelf with a librarian standing in front of it. The larger the shelf is, the more storage capacity it has. The faster that librarian can get a chosen book to you, the lower the latency. The more books they hand you to read (or to write in - some of the books are still blank), the higher your IOPS.
This isn't just tech-nerdery. These numbers matters, because they reflect the value of hardware to your business.
Depending on the exact hard drive and what you’re using it for, any one of these limitations could be the first to slow you down. (This is why we offer two sets of Virtual Dedicated Servers - storage plans for holding onto mountains of data, and performance plans for getting stuff done fast.)
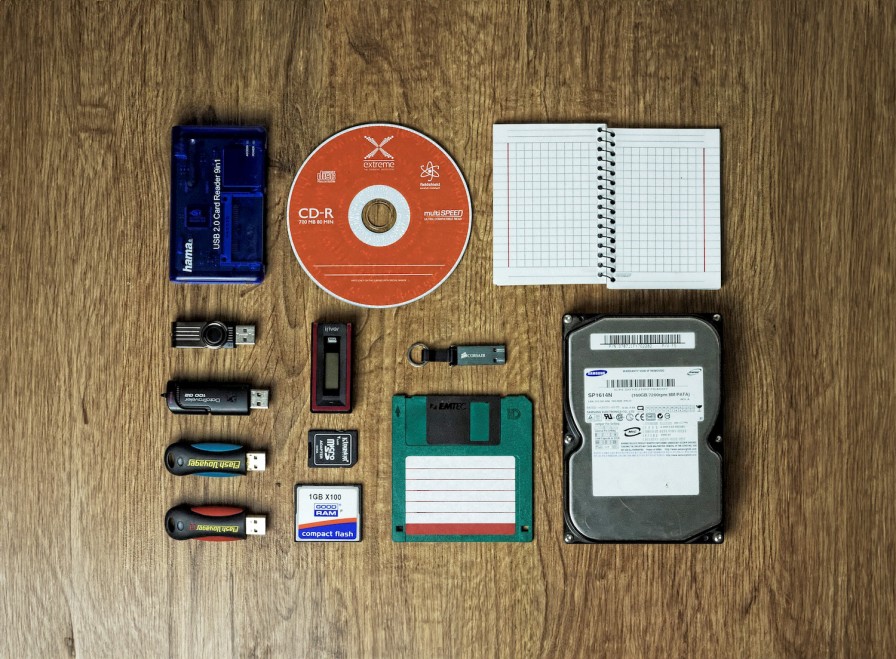
To track the history of capacity, IOPS, and latency since 2007, we need to start with drives that literally have to spin to work. Hosting’s version of the vinyl era.
HDDs: Round and round we go

In our early days everything was stored on spinning drives, known as HDDs (hard disc drives). It’s not just rotation that makes these drives comparable to vinyl LPs, but also their longevity. HDDs have been around in one form or another since the 1950s.
The HDD story is a capacity story
HDDs may not be new and cool, but they are still the best way to provide large amounts of storage at a low price.
HDD storage has gotten 20x cheaper in 15 years. That applies at any price point, for consumer hardware and enterprise hardware.
Thanks to the Wayback Machine, we know that in 2007 our first Dedicated Servers sported drives that store up to 250GB, and that you could get up to four of them: a whole terabyte of storage at your service. (As we'll soon see, a bit of clever mirroring meant that this server stored two copies of 500GB of unique data.) That would have felt like a lot as you scrolled through blog posts about how South By Southwest had just been stormed by a cool new website called Twttr.
Consumer HDDs and enterprise HDDs have shared a similar evolution since then - the same pattern on a different scale. Since consumer drives are easier to track over time, that's where we'll look. It won’t be difficult so long as we can find some obsessively-collected data.

Luckily the internet has everything, including a retired Computer Science professor called John McCallam who has collected the specs and contemporary prices of HDDs going back to 1956(!), and SSDs from 2003 to 2023. Not all heroes wear capes.
So, let’s dig in.
The question we'll ask is what a particular amount of money - say, around US$150 in today’s terms - could buy over the years. Inflation needs to be accounted for, but luckily figures from the US (48.4%, where our data set was collected) and New Zealand (50.6%, where we are based) line up very closely from 2007 to now.
That puts our 2007 benchmark price at US$100 - enough to buy a Western Digital HDD that spun at 7,200 RPM and stored 500GB. Larger drives were available, of course, but cost more than our benchmark price.
Since then, ever-higher amounts of storage have regularly fallen into our price bracket:
Early 2010: 1.5TB (WD)
Mid-2010: 2TB (Seagate)
2013: 3TB (Seagate)
2015: 4TB (WD)
2020: 8TB (Seagate)
After adjusting for inflation these drives all cost US$149-165. Costs are still dropping, too. Today you can get an 8TB drive for about US$120.
At that price, each dollar buys 67GB of storage. Back in 2007, each (adjusted) dollar bought 3.4GB.
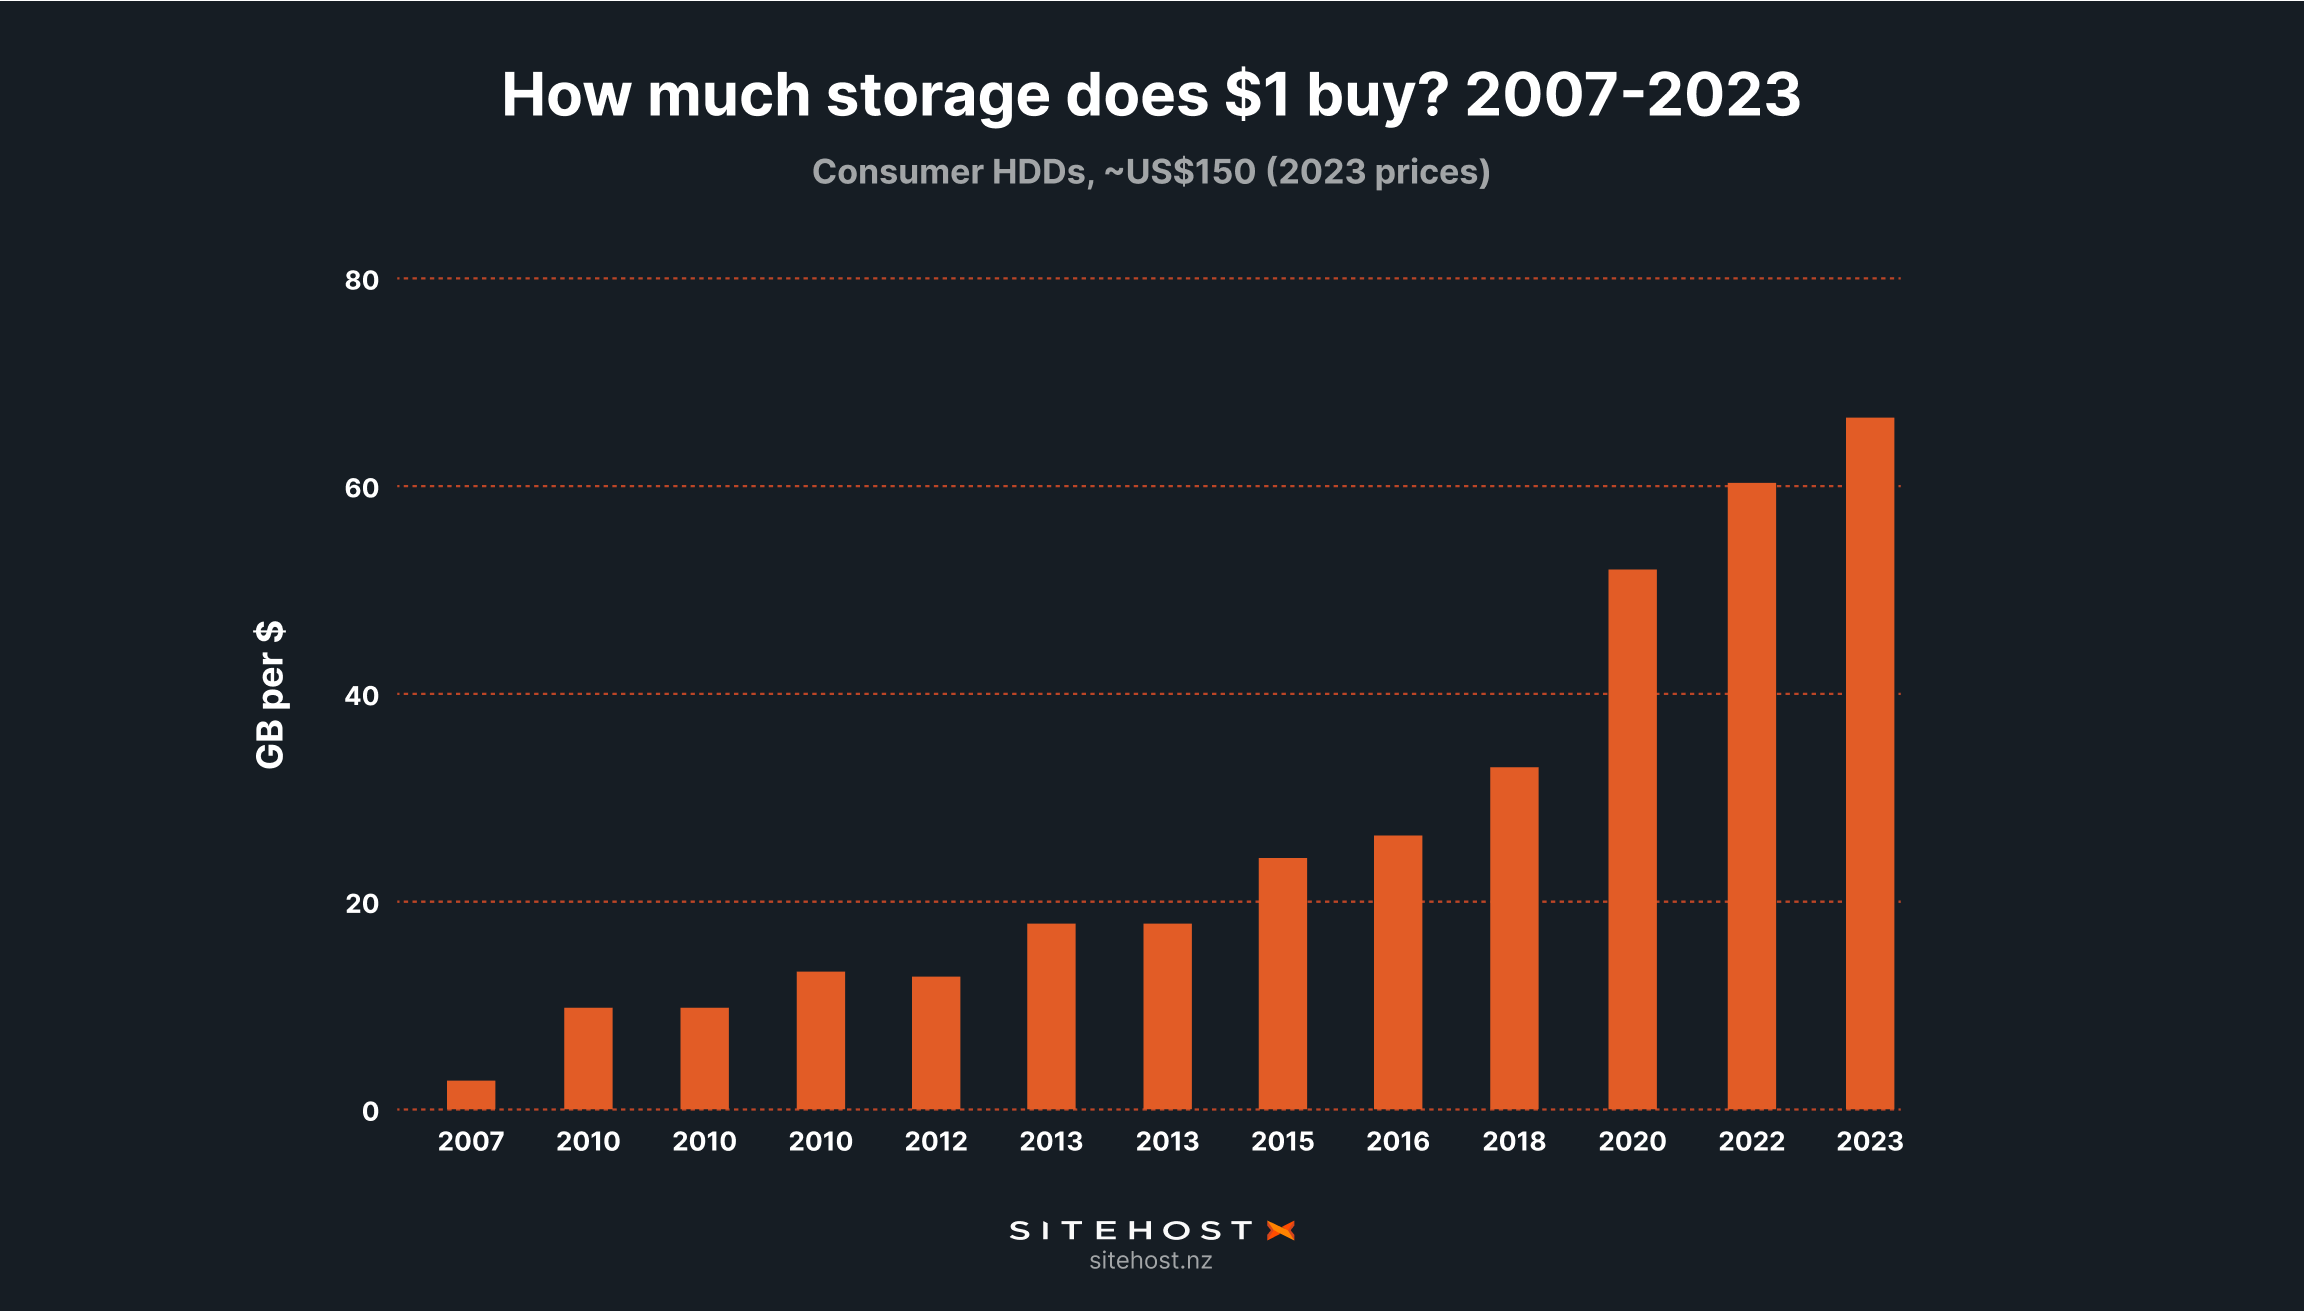
Put another way, HDD storage has gotten 20x cheaper in 15 years. That applies at any price point, for consumer hardware and enterprise hardware. Here at SiteHost we've expanded a bit further than that. As far as our line-up of Dedicated Servers is concerned, today's top spot is a 12 x 14TB Storage Server. It's 168x bigger than the 1TB hero of 2007, at a little over twice the price.
Next, let's look at how IOPS have changed.
Four big presses on the IOPS accelerator
From 2007 to today, the increase in input/output operations is one of the biggest changes in server hardware. Saying exactly how much faster things have gotten is probably impossible, though. There's no standard benchmark because there's no "standard" operation for a computer or server to perform.
Before we attempt any maths to put an overall number on any of this, we need to paint the overall picture. That means looking at four big themes which all build on each other:
Speeding up HDD rotation
Arranging multiple drives in RAID arrays
Introducing solid-state drives (SSDs)
Adopting NVMe storage.
The storage story was all about HDDs getting bigger. The IOPS story has some of that, but it's mostly about entirely new types of hardware.
Spinning up against a physical limit
HDDs can be big and incredibly cost-effective, but they have a speed limit built in. As the disc spins around the drive’s head (akin to the needle on an LP player) is stationary, waiting for the right moment to read or write data. Each moment is a single I/O operation.
In 2007 the HDDs that we started with had a top speed of 7,200 RPM. Later models maxed out at 10,000, then 15,000 RPM. The physical work that underpinned IOPS essentially doubled but it was still the limiting factor.
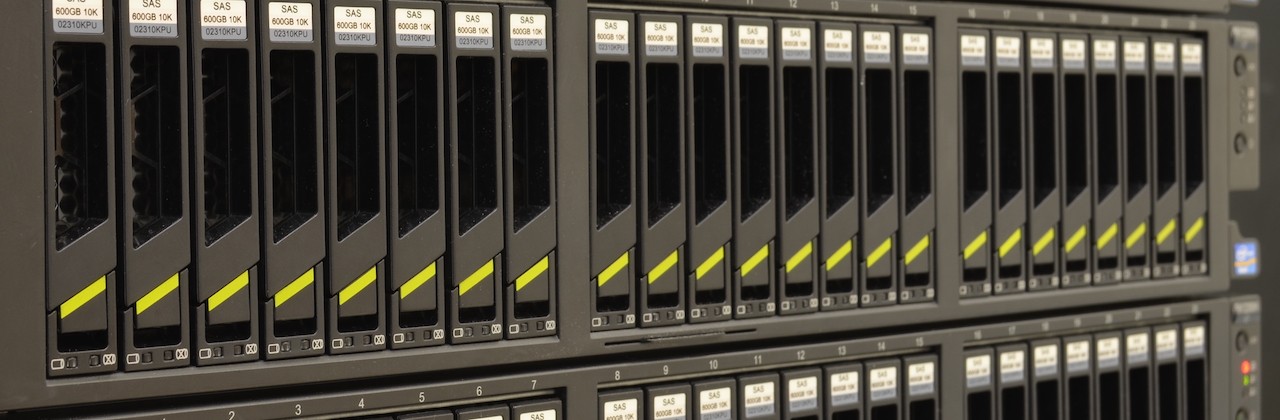
RAID: Working as a team
So how can you get more work out of HDDs if you can't speed them up? Build a team. Two spinning drives working together could do more then one. Four drives could do more than two, and so on. That’s one of the ideas behind RAID, or a redundant array of independent discs.
For stability and reliability, and for faster IOPS, arranging discs in RAID arrays makes sense.
RAID treats an array of discs as a single pool of storage. We found that it improved the performance of databases and applications in particular, but that wasn't our main reason for adopting it.
Redundancy means continuity
If a single, large disc fails you lose everything. That’s catastrophic. RAID greatly reduces the impact because an independent disc won’t take any others down with it. Different RAID “levels” arrange discs in different ways, including our preferred option of a full mirror. With two copies of everything, no single failure loses any data.
There's an IOPS cost, though, because mirroring doubles the amount of writing that the array has to do. So it's not as simple as saying that four discs offer quadruple the speed of a single one. It's more like adding lanes to a motorway - things get quicker, but not in a life-changing way.
For stability and reliability, and for faster IOPS, arranging discs in RAID arrays makes sense. We've been doing it almost as long as we've been assembling hardware. Most of today's arrays don't contain spinning HDDs, and this leads us to the biggest change in IOPS we've seen in our history.
Solid decision-making changed IOPS forever
RAID-arranged HDDs get us up to 2013, when early adopters in the hosting industry started taking solid state drives (SSDs) seriously. We can’t say that SiteHost was first, but we were in the deep end long before most others.
Anything that goes 800 times faster than it used to has sped up a lot.
The switch to SSDs, which don’t spin, sent IOPS into a new stratosphere. Rough numbers are the only option for measuring all this, so we've pulled from a couple of reliable third parties.
Benchmarking of HDD and SSDs by The SSD Review found that while sequential large file IOPS were only 3.5x faster on SSD, the more common activity of random read and write IOPS on a small file was 53x faster.
Testing data from Tom’s Hardware makes those numbers look very conservative. “Most consumer HDDs can handle around 300-1000 input/output operations per second at best," they say, "while SSDs can manage up to 500,000.”
Two notes on the report from Tom's Hardware: They don't specify the exact operations they tested, but clearly they found some that were much quicker the the SSD Review's small file test. And it appears that their most extreme numbers come from comparing cheaper HDDs to more expensive SSDs. That's obviously a bit unfair.
Putting a value on all of this is a bit tricky. We didn't put an exact value on RAID arrays either, so we'll lump that in here. The HDD-to-SSD multipliers that we found range from 3.5x to 1667x. At the the low end, the SSD Review missed some situations where SSDs really shine. The highest numbers came from Tom's Hardware tilting the playing field the other way. So it seems fair, if not conservative, to say that in our experience RAID-arranged SSDs improved overall IOPS by an average factor of 200. Even if we're underselling it this is still huge news.
Another reason we love SSDs: So, So Dependable
The switch to SSDs increased the reliability of our servers as well. As our Technical Director, Quintin, remembers, “a lot of alerts just disappeared”. If there’s a single big decision that we got right about hard drives in our first two decades, it was to adopt SSDs as fast and as widely as we could.
The next step-change came just before the turn of the decade when we adopted NVMe memory, which we still rely on today.
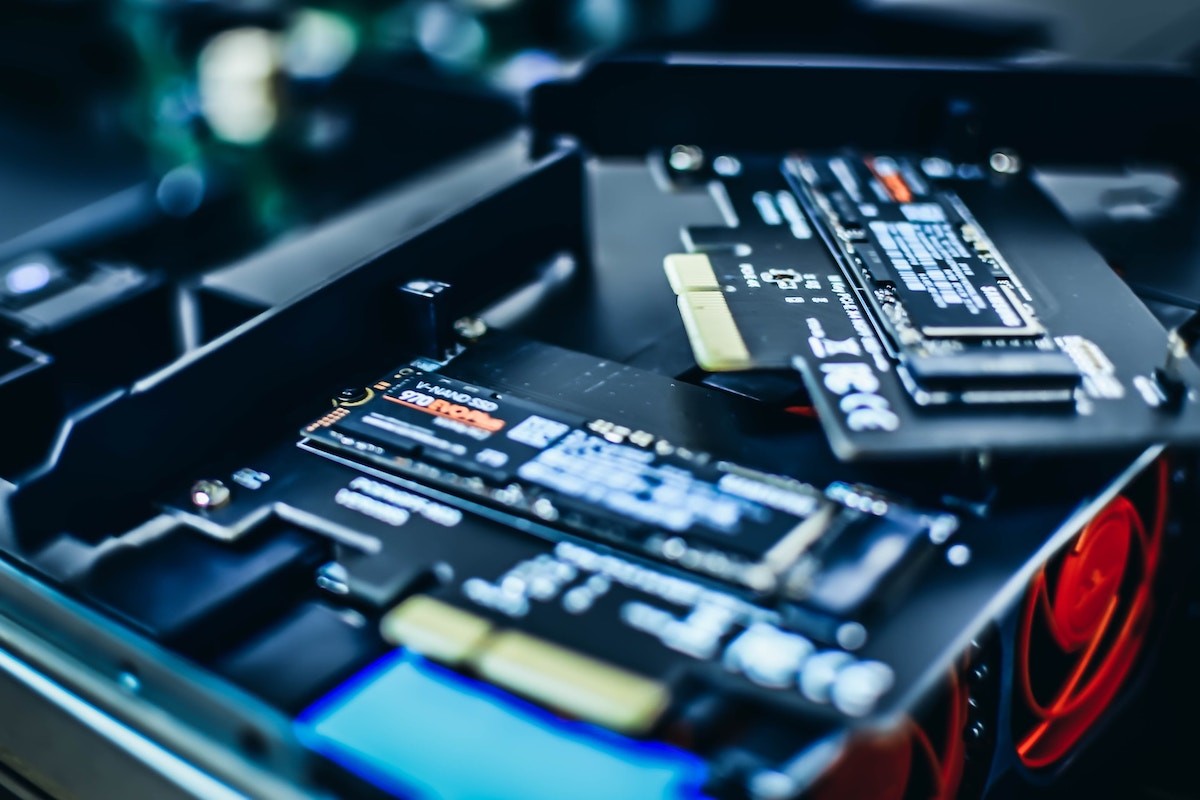
NVMe, oh NVMy
NVMe stands for Non-Volatile Memory Host Express, and that mouthful is our fourth and final IOPS stop. An SSD still holds the data, but the interface between the memory storage and the rest of the machine is new. Here is where we leave slower buses behind and start using the PCI Express standard.
We were healthily sceptical when NVMe drives came on the market, but it didn’t take much testing to convince us that we’d found the future. Latency saw the biggest gains, but in terms of IOPS there was a definite doubling of performance.
Stacking up the IOPS multipliers
Now we have a series of figures that can tell us how IOPS have changed inside SiteHost servers since 2007:
In the HDD era, faster rotation roughly doubled IOPS.
RAID arrays sped things up some more.
We've valued the switch to RAID-arranged SSDs at 200x (from a range of 3.5-1,000+).
Finally, the NVMe era has brought incremental improvements of another 2x.
Line all that up and 2 x 200 x 2 = 800.
Anything that goes 800 times faster than it used to has sped up a lot. Picture a snail going as fast as it can. If your snail is a speedy one, that's about 0.05km/h.

Now picture Usain Bolt setting the 100m world record of 9.58s. Somewhere between his average speed and top speed, he hit 40km/h. By the time he was finished, your snail couldn't have crawled from one end of Usain's shoe to the other. That's what "800x faster" looks like.

Now there's only one question left. How has latency changed?
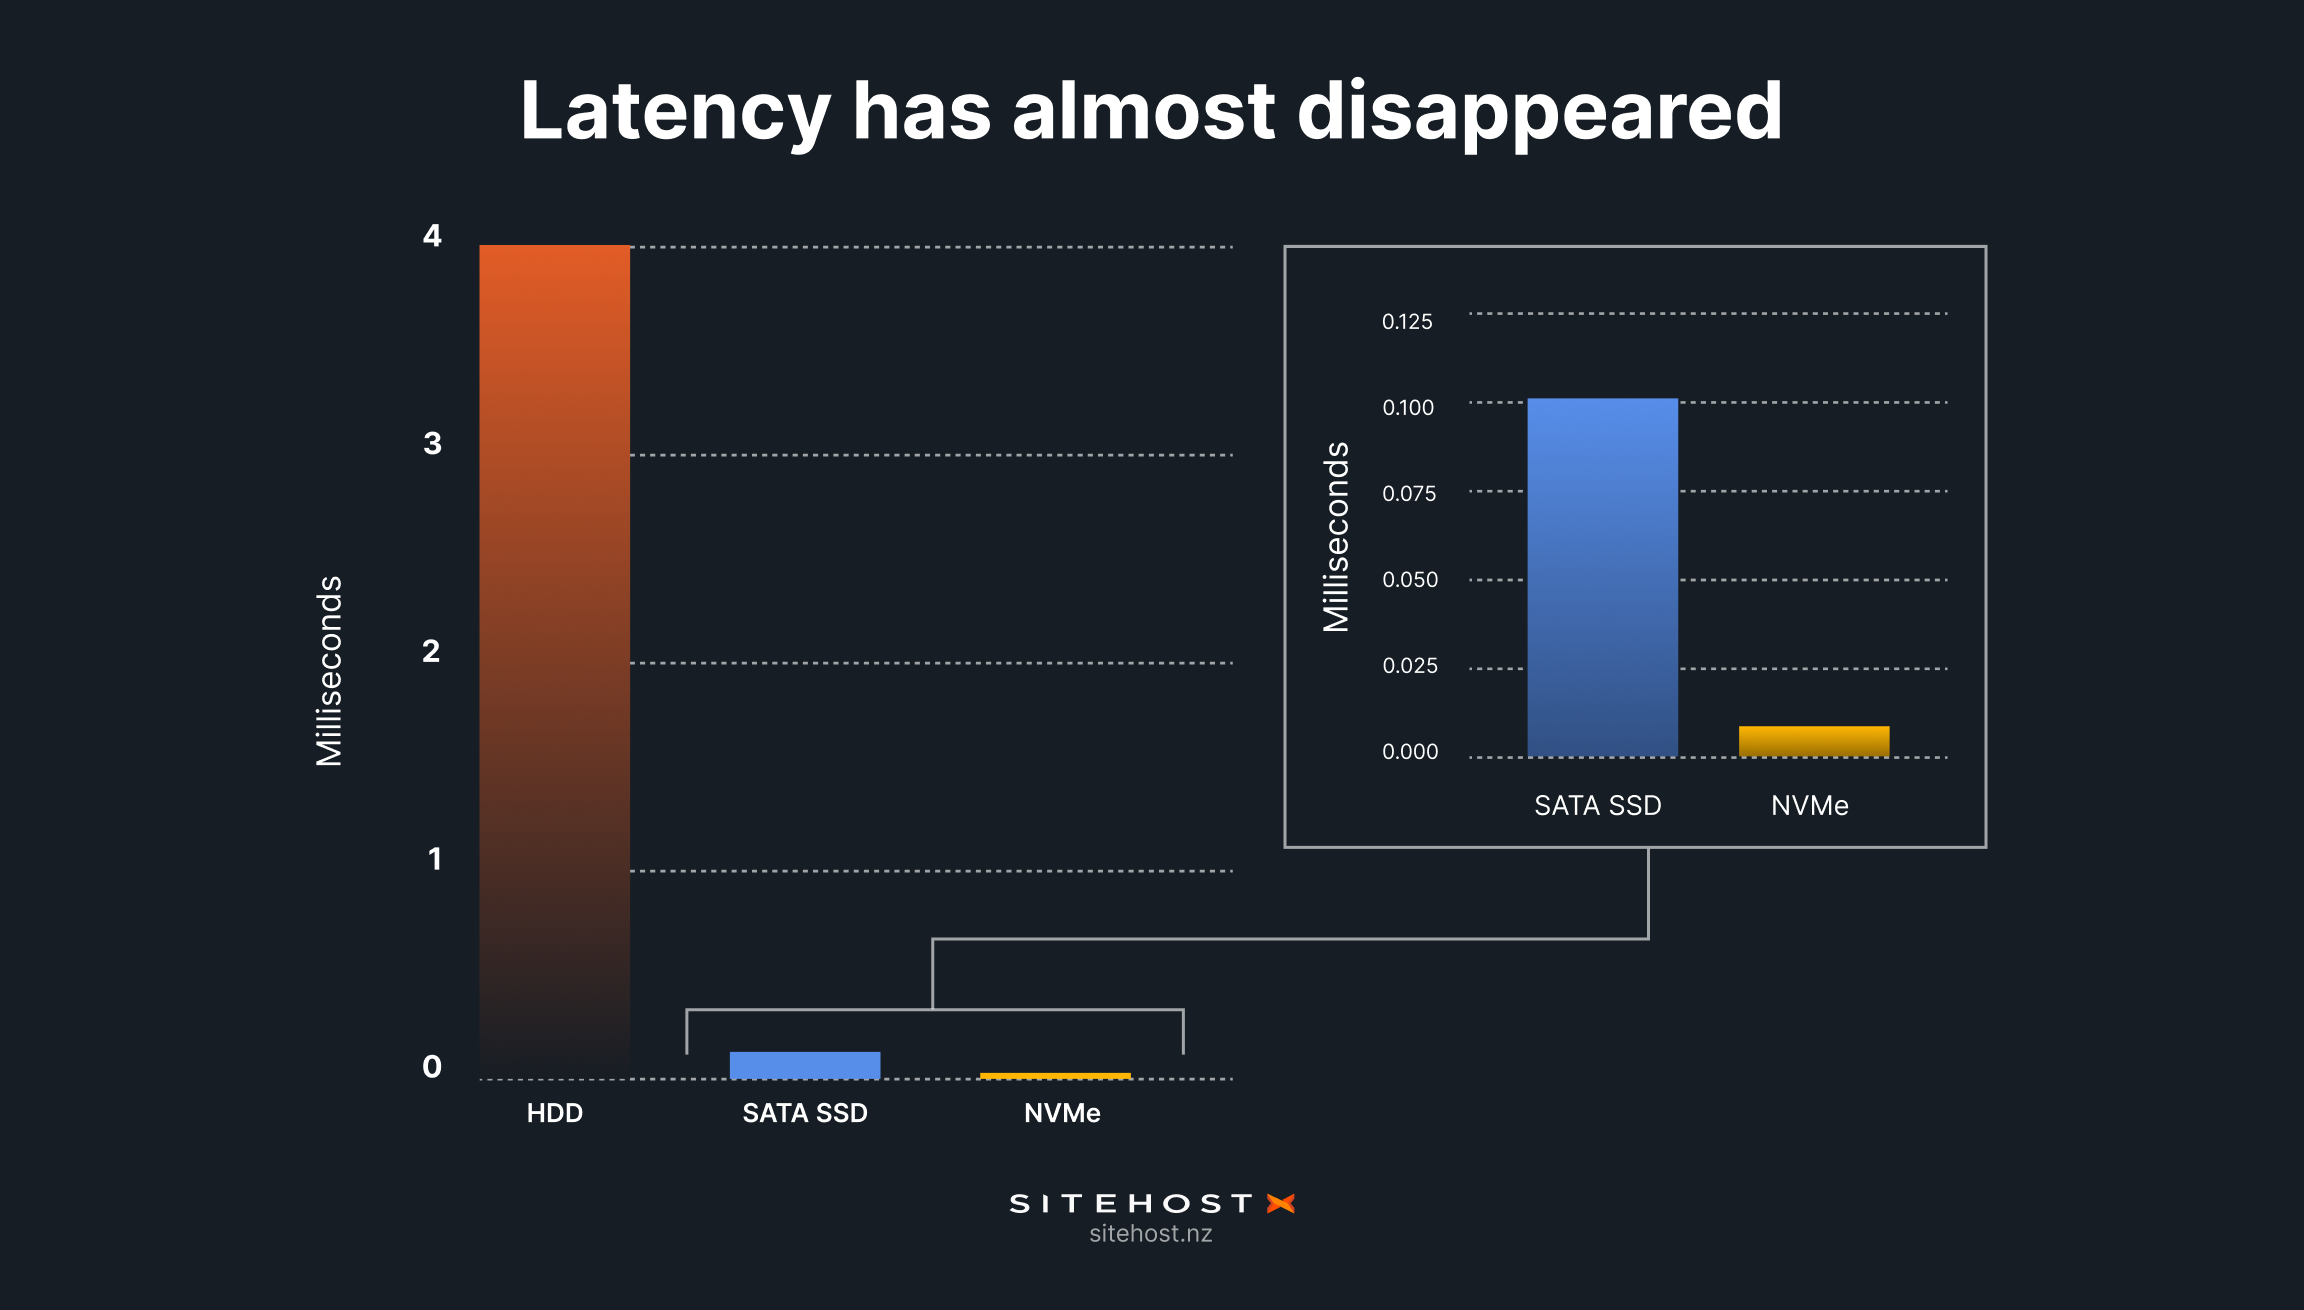
Latency is literally unimaginable now
The same attributes that made SSDs and NVMe such incredible contributors to IOPS have also underpinned a dramatic drop in latency.
NVMe left us with only 10% of an SSD’s already-tiny latency.
For this bit of the story we don't need to talk about HDDs much. Even as they've gotten bigger, and rotated quicker, their latency never really changed. On the plus side, that gives us a solid baseline.
Milli to micro: SSDs changed the unit of latency
When SSDs replace HDDs, latency plummets. We can put exact numbers on this thanks to data sheets from Seagate, one of the world’s largest hard drive manufacturers. Latency is quite stable across each type of drive, so we only need to look at a few products to find what we need to know.
HDDs (whether enterprise or hyperscale models): Average latency = 4.16ms (a millisecond is one-thousandth of a second).
Enterprise SSDs: Average latency = 115μs (that’s microseconds, or millionths of a second).
The longer of these times is roughly a single wingbeat of a housefly. The shorter one is...almost impossible to put into words. It isn't even long enough for the sound of an astonished gasp to get from your vocal cords to your lips.
For fans of whole seconds, this is a drop from 0.00416 to 0.000115. It’s an improvement of 36x. And there’s more to come.

NVMe shifted the decimal point again
As drives improved, so did their connections to the motherboard. We went through various SCSI standards, including SAS (Serial attached SCSI), and SATA (Serial AT Attachment) connectors. Each time, the system’s overall latency would drop.
We've already introduced NVMe above, and mentioned that the biggest gain it brought was in the latency stakes. No joke: NVMe left us with only 10% of an SSD’s already-tiny latency.
That turns 115μs into 11.5μs. That's tiny. In that time, light waves travel about 3.5km, or the length of Queen Street.
Today a big determiner of latency is the physical distance that electrons have to travel between, and within, server components. Smaller drives help, as do closer connections between drives and the server’s motherboard. NVMe drives are compact, and they plug in directly.
From 2007 to today, latency has dropped from 4.16ms to 11.5μs. That's a 360x improvement.
This is one reason why we’re almost all-in on NVMe today. Our entire Cloud Container platform, our Virtual Server fleets (both Linux and Windows machines), and our Performance VDS packages all rely on NVMe storage.
Where we are today: The incredible numbers that show the evolution of data storage
If you were amazed, like we were, when we saw that CPUs literally got 100 times better since 2007, the storage story is mind-blowing. Two out of three metrics have risen much, much further.
Latency: 360x.
Capacity (GB per $): 20x
IOPS (conservative estimate): 800x.
This isn't just tech-nerdery. These numbers matters, because they reflect the value of hardware to your business.
When companies leave the cloud, it’s usually because they can rent or purchase hardware that outperforms anything that was available when they chose AWS, Azure or Google Cloud as their infrastructure provider.
The pendulum is swinging against cloud services
Cloud service providers, as the default option for enterprise technology, are in an era of profit maximisation. AWS is well-known for bamboozling customers with tricky billing. There's growing evidence that they would rather add fees than fix problems. This is the behaviour of an overly comfortable supplier, not a deeply competitive one.
Meanwhile the Virtual Servers and Dedicated Servers (a.k.a. bare metal) that you can access from providers like us are streaking ahead. The closer your billing is to the metal that your business runs on, the better. Abstracted services are the layer where the fat is being slathered on by our giant international competitors.
From both sides, the financial maths keeps changing in favour of operating your own hardware. You get ever more for your dollar when you invest in bare metal, and you get ever more pressure on your wallet when you pick a hyperscale provider like AWS.
A dollar buys 67GB of storage. Back in 2007, each dollar bought 3.4GB.
That said, not every supplier of servers is equal. At SiteHost we started this decade with a very serious hardware refresh, adopting NVMe at around the same time as new CPUs from AMD. A lot of others are still catching up, while we’ve moved on through the generations. As components evolve, hardware compatibility is a moving puzzle. We have kept finding solutions quickly, thanks in no small part to strong, productive relationships with our suppliers.
So if you want to find out what you could be paying for all the computing power your business needs, it’s clear who you should talk to first.