New Cloud Container metrics put much, much more data in your hands
A big addition to the Cloud Container platform introduces new graphic breakdowns of metrics like CPU, RAM, and disk usage per server or per container. Start drilling into the details now.


A new, major addition to the Cloud Container platform gives every user access to a gorgeous Metrics interface with granular performance data, beautifully graphed out and filterable by server or container. It's a powerful data-vis feature that a lot of people have asked for and which is already getting great feedback.
For a long time you’ve had access to five graphs in the SiteHost Control Panel: CPU usage, load, memory usage, bandwidth, and disk usage. This is useful, but in-house our Support Team could see a lot more than that. With this new release we've cut out the need for you to call on our Support Team for more sophisticated monitoring data. Information is power, after all, and we'd rather put that power in your hands, where it belongs.
You've always had a magnifying glass, and now there's a microscope in your toolkit as well. We've already heard from some of the first users who found the link and took a look, and based on their positive words, you're going to like what you see!
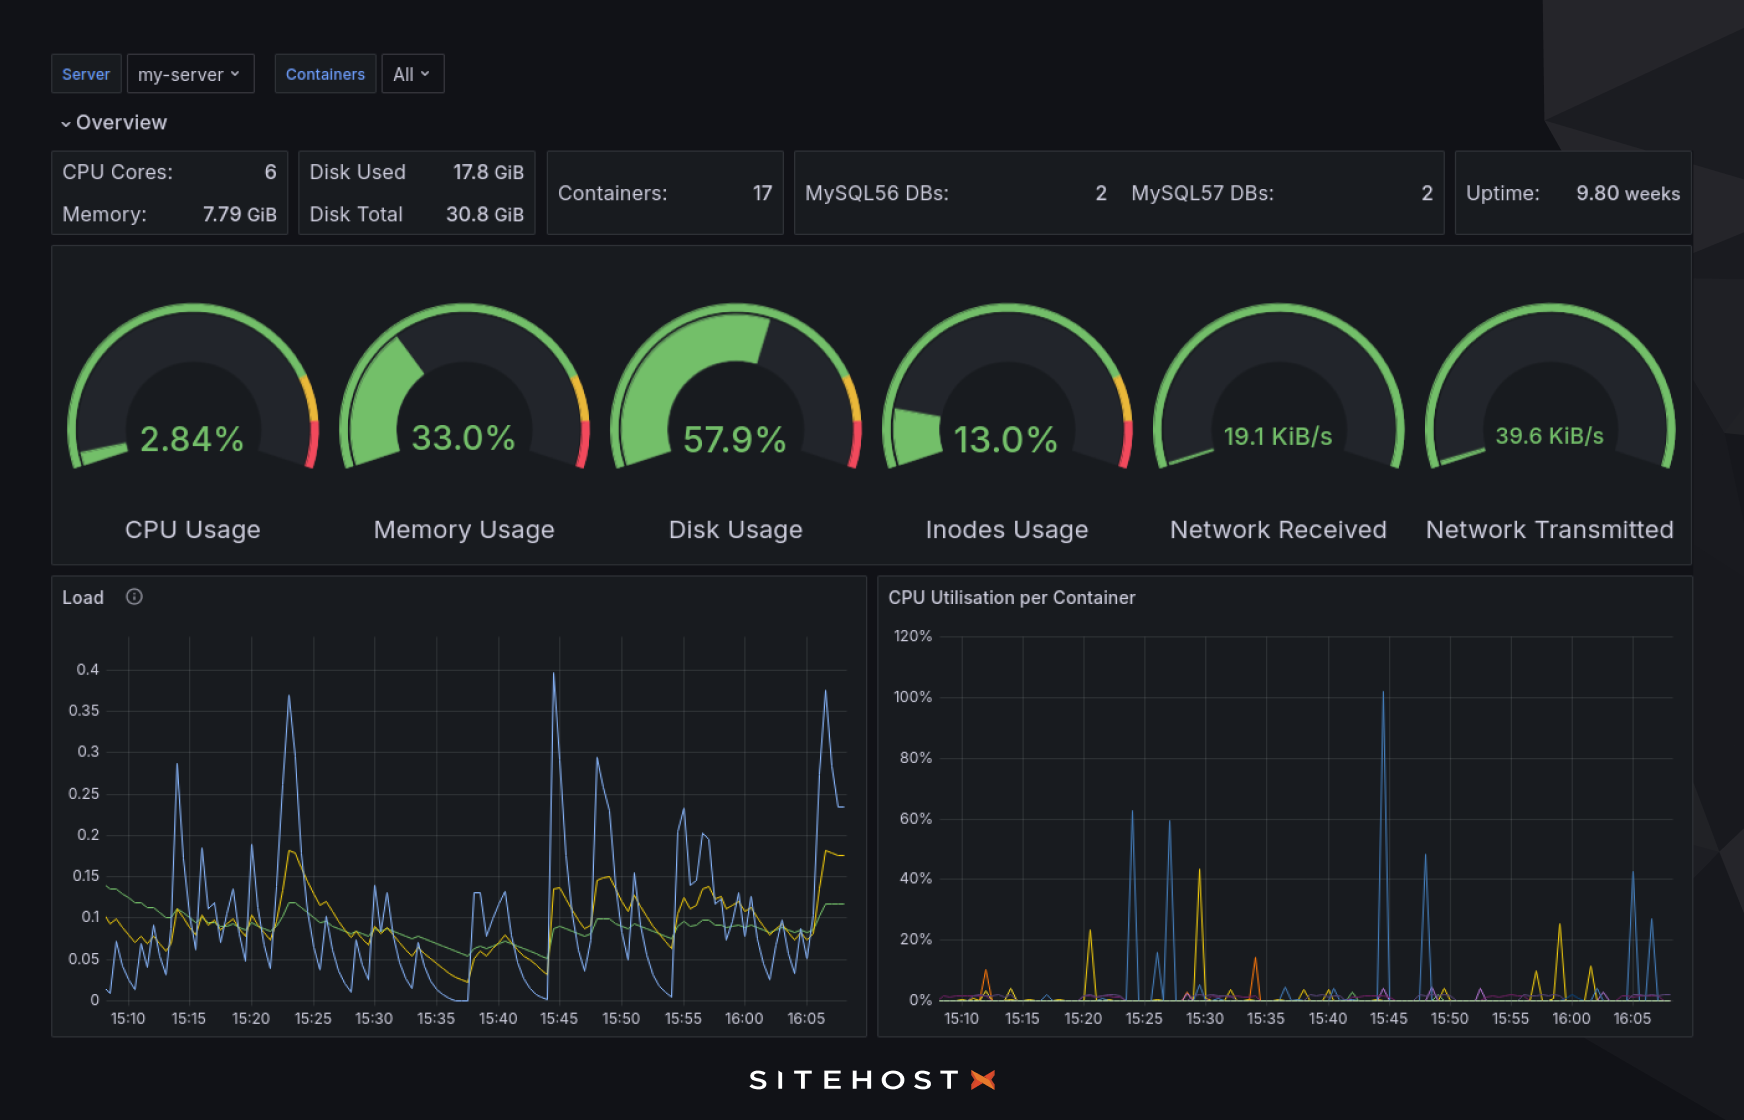
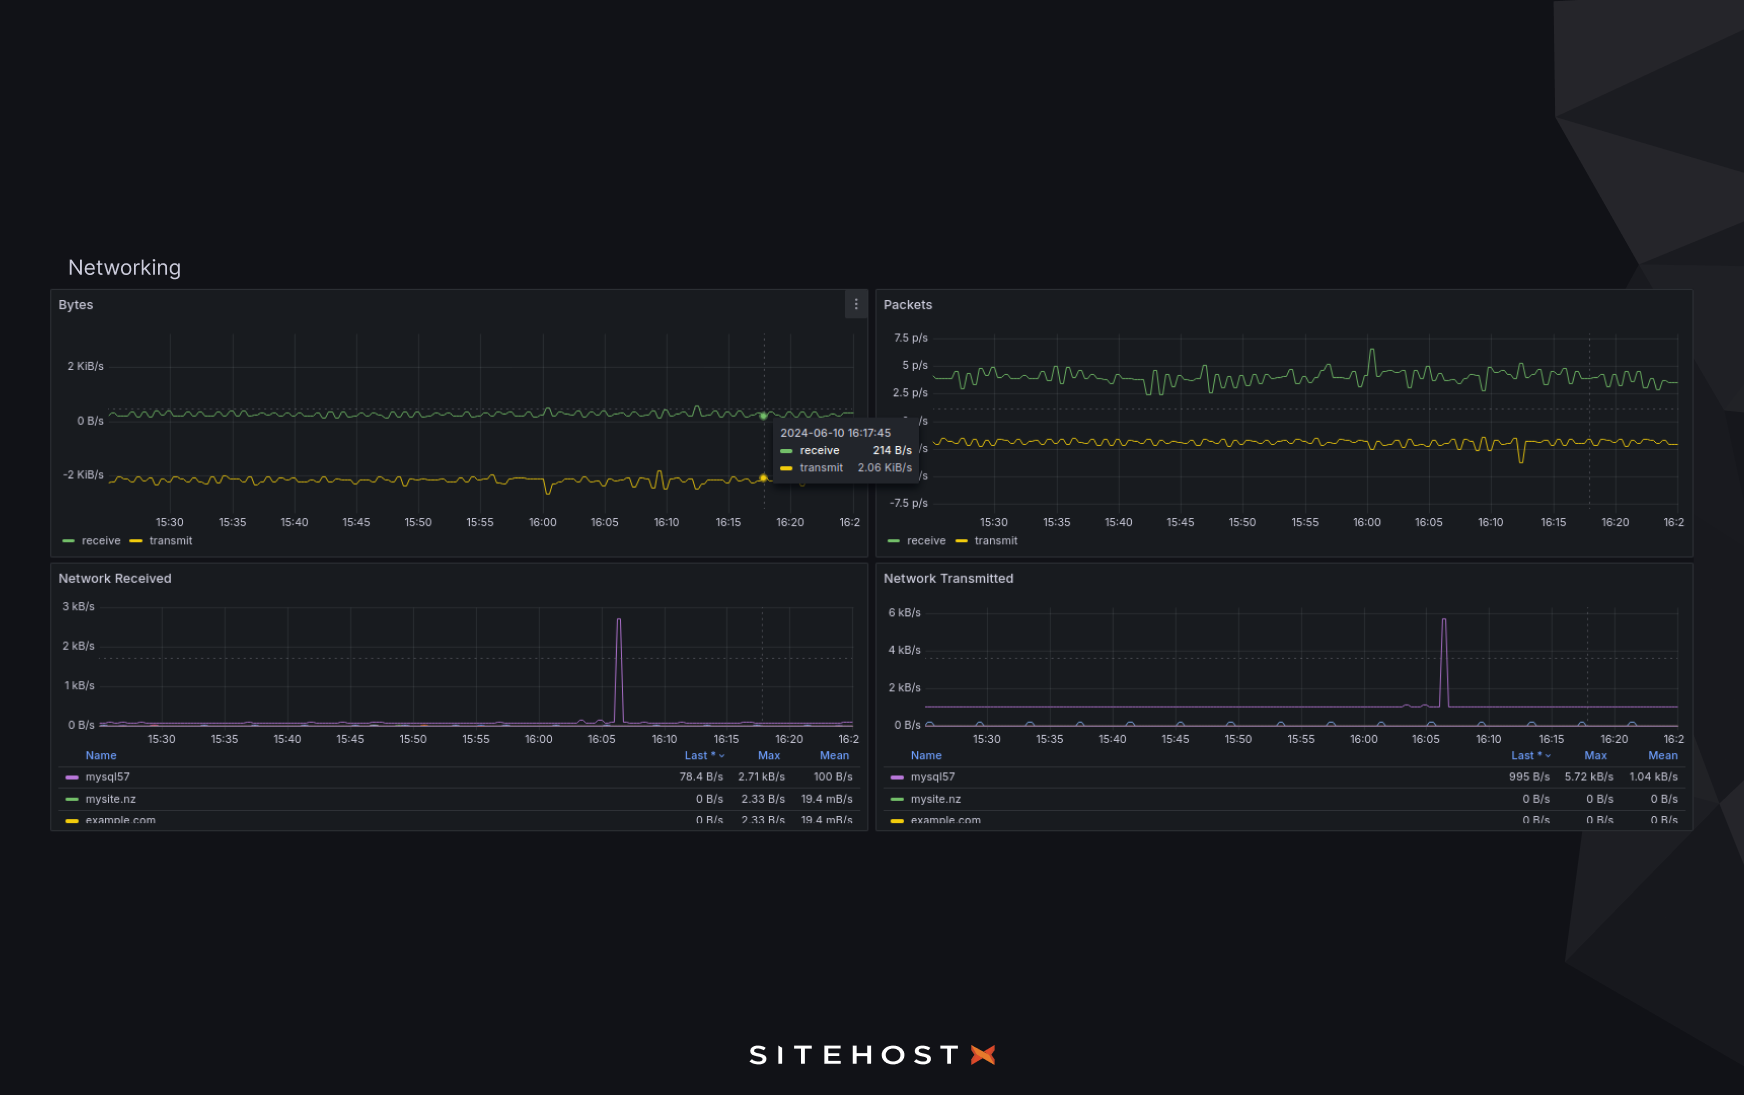
We're talking about more than two dozen graphs, with the option to view data over entire servers or separate containers. You can also choose your timespan (as short as five minutes or, as the data builds up over time, as long as an entire year).
With this data in your hands, you’ll be able to keep a much closer eye on your servers and containers. You’ll be able to see trends or changes before they turn into issues, and you’ll be able to act quicker to keep everything running smoothly.
More information than we can mention
This blog article isn’t the place to describe each and every dataset that the new metrics screen will lay out for you. That would be a very long read, and we all know that showing is better than telling. So here's how to take a look:
Log into your SiteHost Control Panel and select a server or container to view.
On the main details screen for the container or server, click the new Metrics option (it’s at the top-right, next to Reboot).
In the new tab that opens, start browsing all your new metrics data.
The interface is fairly straightforward, but if you have any questions then the Knowledge Base is the first place to look for answers. There's a bit about account authorisation, and about sub-accounts and their parents in there too.
This new Metrics feature is separate from the graphs that have long been available in the Control Panel. It will most likely end up as a replacement, but for now we're running Metrics and Graphs side-by-side.
High-quality ingredients
In recent years we've built out a lot of new metric-collecting capabilities. With clever and careful querying, a bit of mathematics, and finally the construction of useful dashboards, the end result is a brand new suite of graphs.
This is why this data is now more detailed and granular than ever.

The data-vis itself is done in a tool called Grafana. That’s why it pops up in a new tab. The graphs that we’ve included in the first version of the dashboard were chosen for a few different reasons, but the guiding principle was that if we find it useful, you probably will too. There could be room for more, so we’d love to hear any ideas that you have.
Have a look at your new Cloud Container metrics today and let us know what you think.