Cloud Container logs have moved in next door to your metrics
Your metrics dashboard has been updated to include logs right alongside all your other important graphs and data.

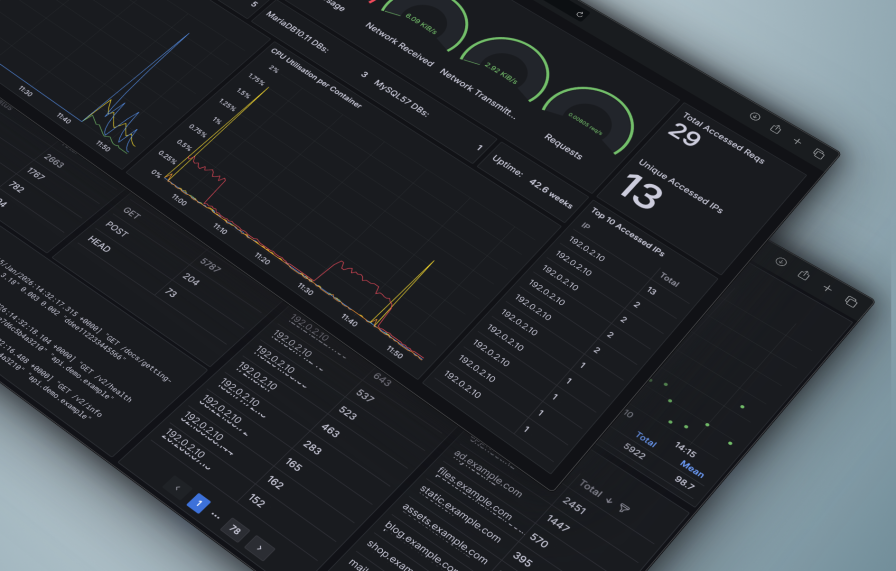
Two years ago we handed every Cloud Container customer a proper metrics dashboard. That included over two dozen graphs of CPU, RAM and disk, all filterable right down to a single Container.
The metrics dashboard has always given you access to a lot of useful graphs and data, but there was one thing missing: the story behind the numbers. Today we're adding exactly that. Now your logs sit in the dashboard, right alongside your metrics.
Whenever you see a graph spike, the logical question is usually “...why?".
Previously, that had meant coming to us for answers. We thought it would be better if we made that information more accessible. The same metrics dashboard you’re already using for performance data now shows the web request logs for the proxy in front of your Containers. Every request that hits your site now sits in one searchable place.

See what your site is actually doing
For each server and individual Container you get visibility of:
Request rates: How many requests per second you're serving right now, plotted minute-by-minute, so a traffic spike is impossible to miss.
HTTP status codes: Spot a wave of 404 or 429 errors from the moment they start, instead of hearing about it from your customers.
Top accessed IPs: A ranked list of who's hitting your site hardest, so bots and runaway clients stand out at a glance.
Lots more data: Request methods, your busiest Containers, the Container behind each request, and the full log feed behind it all, ready to search.
No more guessing which Container is throwing errors, or whether that traffic spike came from real visitors or from bots. The evidence is right there, next to the graph that made you ask questions in the first place.

How to take a look
You can find the logs in the same metrics dashboard that you’re already familiar with. Here’s how to find it:
Log into your SiteHost Control Panel.
Select a Container or server to view.
On the main details screen for the Container or server, click the metrics option (on the top-right, next to Reboot).
In the new tab that opens, browse your logs alongside all your other metrics data.
Filter by server, by Container, and by whatever timespan you need, from the last five minutes to the last three months.
We’ve tried to make the dashboard as straightforward as possible, but if you have any questions about using it, our Knowledge Base is the best place to look for answers.
Information is a powerful tool, and we believe you should have control and visibility over it. That’s why we’re giving you access to deeper, richer data and logs. Have a look at the new logs in the metrics dashboard today, and let us know what you'd like to see next.